WGCNA:官方教程学习之共识分析

数据清洗

1
2
3
library(WGCNA)  #加载WGCNA包
enableWGCNAThreads() #开启多线程
options(stringsAsFactors = FALSE) #避免某些错误匹配
1
2
3
4
5
6
7
#Read in the female liver data set
femData = read.csv("LiverFemale3600.csv");
# Read in the male liver data set
maleData = read.csv("LiverMale3600.csv");
# For easier labeling of plots, create a vector holding descriptive names of the two sets.
setLabels = c("Female liver", "Male liver")
shortLabels = c("Female", "Male")
1
2
3
4
5
6
7
8
9
10
11
12
13
# We work with two sets:
nSets = 2;
# Form multi-set expression data: columns starting from 9 contain actual expression data.
multiExpr = vector(mode = "list", length = nSets)
multiExpr[[1]] = list(data = as.data.frame(t(femData[-c(1:8)])));
names(multiExpr[[1]]$data) = femData$substanceBXH;
rownames(multiExpr[[1]]$data) = names(femData)[-c(1:8)];
multiExpr[[2]] = list(data = as.data.frame(t(maleData[-c(1:8)])));
names(multiExpr[[2]]$data) = maleData$substanceBXH;
rownames(multiExpr[[2]]$data) = names(maleData)[-c(1:8)];
# Check that the data has the correct format for many functions operating on multiple sets:
exprSize = checkSets(multiExpr)
exprSize
1
2
3
4
5
6
7
8
9
10
11
12
13
14
15
16
17
18
gsg = goodSamplesGenesMS(multiExpr, verbose = 3);
gsg$allOK
if (!gsg$allOK){
# Print information about the removed genes:
if (sum(!gsg$goodGenes) > 0){
printFlush(paste("Removing genes:", paste(names(multiExpr[[1]]$data)[!gsg$goodGenes],collapse = ", ")))
}
for (set in 1:exprSize$nSets){
if (sum(!gsg$goodSamples[[set]])){
printFlush(paste("In set", setLabels[set], "removing samples",
paste(rownames(multiExpr[[set]]$data)[!gsg$goodSamples[[set]]], collapse = ", ")))
}
# Remove the offending genes and samples
multiExpr[[set]]$data = multiExpr[[set]]$data[gsg$goodSamples[[set]], gsg$goodGenes];
}
# Update exprSize
exprSize = checkSets(multiExpr)
}
1
2
3
4
5
6
7
8
sampleTrees = list()
for (set in 1:nSets){
sampleTrees[[set]] = hclust(dist(multiExpr[[set]]$data), method = "average")
}
for (set in 1:nSets){
plot(sampleTrees[[set]], main = paste("Sample clustering on all genes in", setLabels[set]),
xlab="", sub="", cex = 0.7);
}
1
2
3
4
5
6
7
8
9
10
# Choose the "base" cut height for the female data set
baseHeight = 16
# Adjust the cut height for the male data set for the number of samples
cutHeights = c(1, exprSize$nSamples[2]/exprSize$nSamples[1])*baseHeight
# Re-plot the dendrograms including the cut lines
for (set in 1:nSets){
plot(sampleTrees[[set]], main = paste("Sample clustering on all genes in", setLabels[set]),
xlab="", sub="", cex = 0.7);
abline(h=cutHeights[set], col = "red");
}
1
2
3
4
5
6
7
8
9
10
11
for (set in 1:nSets){
# Find clusters cut by the line
labels = cutreeStatic(sampleTrees[[set]], cutHeight = cutHeights[set])
# Keep the largest one (labeled by the number 1)
keep = (labels==1)
multiExpr[[set]]$data = multiExpr[[set]]$data[keep, ]
}
collectGarbage();
# Check the size of the leftover data
exprSize = checkSets(multiExpr)
exprSize
1
2
3
4
5
6
7
8
9
10
11
12
traitData = read.csv("ClinicalTraits.csv");
# remove columns that hold information we do not need.
allTraits = traitData[, -c(31, 16)];
allTraits = allTraits[, c(2, 11:36)];
Traits = vector(mode="list", length = nSets);
for (set in 1:nSets){
setSamples = rownames(multiExpr[[set]]$data);
traitRows = match(setSamples, allTraits$Mice);
Traits[[set]] = list(data = allTraits[traitRows, -1]);
rownames(Traits[[set]]$data) = allTraits[traitRows, 1];
}
collectGarbage();

得到一个multiExpr,以列表的形式存储了所有的表达矩阵;一个Traits,以列表的形式存储了所有的性状矩阵

构建共识网络模块

选择合适的β值

1
2
3
4
5
6
7
8
9
10
11
12
13
14
15
16
17
18
19
20
21
22
23
24
25
26
27
28
29
30
31
32
33
34
35
36
37
38
39
40
41
42
43
44
45
46
# Choose a set of soft-thresholding powers
powers = c(seq(4,10,by=1), seq(12,20, by=2));
# Initialize a list to hold the results of scale-free analysis
powerTables = vector(mode = "list", length = nSets);
# Call the network topology analysis function for each set in turn
for (set in 1:nSets){
powerTables[[set]] = list(data = pickSoftThreshold(multiExpr[[set]]$data, powerVector=powers,
verbose = 2)[[2]]);
}
collectGarbage();
# Plot the results:
colors = c("black", "red")
# Will plot these columns of the returned scale free analysis tables
plotCols = c(2,5,6,7)
colNames = c("Scale Free Topology Model Fit", "Mean connectivity", "Median connectivity",
"Max connectivity");
# Get the minima and maxima of the plotted points
ylim = matrix(NA, nrow = 2, ncol = 4);
for (set in 1:nSets){
for (col in 1:length(plotCols)){
ylim[1, col] = min(ylim[1, col], powerTables[[set]]$data[, plotCols[col]], na.rm = TRUE);
ylim[2, col] = max(ylim[2, col], powerTables[[set]]$data[, plotCols[col]], na.rm = TRUE);
}
}
# Plot the quantities in the chosen columns vs. the soft thresholding power
cex1 = 0.7;
for (col in 1:length(plotCols)) for (set in 1:nSets){
if (set==1){
plot(powerTables[[set]]$data[,1], -sign(powerTables[[set]]$data[,3])*powerTables[[set]]$data[,2],
xlab="Soft Threshold (power)",ylab=colNames[col],type="n", ylim = ylim[, col],
main = colNames[col]);
addGrid();
}
if (col==1){
text(powerTables[[set]]$data[,1], -sign(powerTables[[set]]$data[,3])*powerTables[[set]]$data[,2],
labels=powers,cex=cex1,col=colors[set]);
} else{
text(powerTables[[set]]$data[,1], powerTables[[set]]$data[,plotCols[col]],
labels=powers,cex=cex1,col=colors[set]);
}
if (col==1){
legend("bottomright", legend = setLabels, col = colors, pch = 20) ;
}else{
legend("topright", legend = setLabels, col = colors, pch = 20) ;
}
}

计算邻接矩阵

1
2
3
4
5
6
7
8
9
softPower = 7;
# Initialize an appropriate array to hold the adjacencies
nGenes = exprSize$nGenes;
nSamples = exprSize$nSamples;
adjacencies = array(0, dim = c(nSets, nGenes, nGenes));
# Calculate adjacencies in each individual data set
for (set in 1:nSets){
adjacencies[set, , ] = abs(bicor(multiExpr[[set]]$data, use = "p", maxPOutliers = 0.05))^softPower;
}

计算拓扑重叠矩阵

1
2
3
4
5
TOM = array(0, dim = c(nSets, nGenes, nGenes));
# Calculate TOMs in each individual data set
for (set in 1:nSets){
TOM[set, , ] = TOMsimilarity(adjacencies[set, , ])
}

缩放拓扑重叠矩阵保证可比性

1
2
3
4
5
6
7
8
9
10
11
12
13
14
15
16
17
18
19
20
21
22
23
24
25
26
# Define the reference percentile
scaleP = 0.95
# Set RNG seed for reproducibility of sampling
set.seed(12345)
# Sample sufficiently large number of TOM entries
nSamples = as.integer(1/(1-scaleP) * 1000);
# Choose the sampled TOM entries
scaleSample = sample(nGenes*(nGenes-1)/2, size = nSamples)
TOMScalingSamples = list();
# These are TOM values at reference percentile
scaleQuant = rep(1, nSets)
# Scaling powers to equalize reference TOM values
scalePowers = rep(1, nSets)
# Loop over sets
for (set in 1:nSets){
# Select the sampled TOM entries
TOMScalingSamples[[set]] = as.dist(TOM[set, , ])[scaleSample]
# Calculate the 95th percentile
scaleQuant[set] = quantile(TOMScalingSamples[[set]],
probs = scaleP, type = 8);
# Scale the male TOM
if (set>1){
scalePowers[set] = log(scaleQuant[1])/log(scaleQuant[set]);
TOM[set, ,] = TOM[set, ,]^scalePowers[set];
}
}
1
2
3
4
5
6
7
8
9
10
11
12
13
14
# For plotting, also scale the sampled TOM entries
scaledTOMSamples = list();
for (set in 1:nSets){
scaledTOMSamples[[set]] = TOMScalingSamples[[set]]^scalePowers[set]
}
# qq plot of the unscaled samples
qqUnscaled = qqplot(TOMScalingSamples[[1]], TOMScalingSamples[[2]], plot.it = TRUE, cex = 0.6,
xlab = paste("TOM in", setLabels[1]), ylab = paste("TOM in", setLabels[2]),
main = "Q-Q plot of TOM", pch = 20)
# qq plot of the scaled samples
qqScaled = qqplot(scaledTOMSamples[[1]], scaledTOMSamples[[2]], plot.it = FALSE)
points(qqScaled$x, qqScaled$y, col = "red", cex = 0.6, pch = 20);
abline(a=0, b=1, col = "blue")
legend("topleft", legend = c("Unscaled TOM", "Scaled TOM"), pch = 20, col = c("black", "red"))

计算共识拓扑重叠矩阵

1
consensusTOM = pmin(TOM[1, , ], TOM[2, , ])

聚类并鉴定网络模块

1
2
3
4
5
6
7
8
9
10
11
12
13
# Clustering
consTree = hclust(as.dist(1-consensusTOM), method = "average");
# We like large modules, so we set the minimum module size relatively high:
minModuleSize = 30;
# Module identification using dynamic tree cut:
unmergedLabels = cutreeDynamic(dendro = consTree, distM = 1-consensusTOM,
deepSplit = 2, cutHeight = 0.995,
minClusterSize = minModuleSize,
pamRespectsDendro = FALSE );
unmergedColors = labels2colors(unmergedLabels)
plotDendroAndColors(consTree, unmergedColors, "Dynamic Tree Cut",
dendroLabels = FALSE, hang = 0.03,
addGuide = TRUE, guideHang = 0.05)

合并相似矩阵

1
2
3
4
5
6
7
8
9
10
11
12
13
14
15
16
17
18
19
20
21
22
# Calculate module eigengenes
unmergedMEs = multiSetMEs(multiExpr, colors = NULL, universalColors = unmergedColors)
# Calculate consensus dissimilarity of consensus module eigengenes
consMEDiss = consensusMEDissimilarity(unmergedMEs);
# Cluster consensus modules
consMETree = hclust(as.dist(consMEDiss), method = "average");
# Plot the result
par(mfrow = c(1,1))
plot(consMETree, main = "Consensus clustering of consensus module eigengenes",
xlab = "", sub = "")
abline(h=0.25, col = "red")
merge = mergeCloseModules(multiExpr, unmergedLabels, cutHeight = 0.25, verbose = 3)
# Numeric module labels
moduleLabels = merge$colors;
# Convert labels to colors
moduleColors = labels2colors(moduleLabels)
# Eigengenes of the new merged modules:
consMEs = merge$newMEs
plotDendroAndColors(consTree, cbind(unmergedColors, moduleColors),
c("Unmerged", "Merged"),
dendroLabels = FALSE, hang = 0.03,
addGuide = TRUE, guideHang = 0.05)

关联共识网络模块与普通网络模块

WGCNA:官方教程学习之网络分析中获得了普通网络模块,将其导出

1
2
3
4
5
6
7
# Rename variables to avoid conflicts
femaleLabels = moduleLabels;
femaleColors = moduleColors;
femaleTree = geneTree;
femaleMEs = orderMEs(MEs, greyName = "ME0");
save(femaleMEs, femaleLabels, femaleColors, femaleTree,
file = "FemaleLiver-02-networkConstruction.RData")
1
2
lnames = load('FemaleLiver-02-networkConstruction.RData')
lnames
1
2
3
4
5
6
7
8
9
10
11
12
13
14
15
16
17
18
19
20
21
# Isolate the module labels in the order they appear in ordered module eigengenes
femModuleLabels = substring(names(femaleMEs), 3)
consModuleLabels = substring(names(consMEs[[1]]$data), 3)
# Convert the numeric module labels to color labels
femModules = femModuleLabels
consModules = labels2colors(as.numeric(consModuleLabels))
# Numbers of female and consensus modules
nFemMods = length(femModules)
nConsMods = length(consModules)
# Initialize tables of p-values and of the corresponding counts
pTable = matrix(0, nrow = nFemMods, ncol = nConsMods);
CountTbl = matrix(0, nrow = nFemMods, ncol = nConsMods);
# Execute all pairwaise comparisons
for (fmod in 1:nFemMods){
for (cmod in 1:nConsMods){
femMembers = (femaleColors == femModules[fmod]);
consMembers = (moduleColors == consModules[cmod]);
pTable[fmod, cmod] = -log10(fisher.test(femMembers, consMembers, alternative = "greater")$p.value);
CountTbl[fmod, cmod] = sum(femaleColors == femModules[fmod] & moduleColors == consModules[cmod])
}
}
1
2
3
4
5
6
7
8
9
10
11
12
13
14
15
16
17
18
19
20
21
# Truncate p values smaller than 10^{-50} to 10^{-50}
pTable[is.infinite(pTable)] = 1.3*max(pTable[is.finite(pTable)]);
pTable[pTable>50 ] = 50 ;
# Marginal counts (really module sizes)
femModTotals = apply(CountTbl, 1, sum)
consModTotals = apply(CountTbl, 2, sum)
#pdf(file = "Plots/ConsensusVsFemaleModules.pdf", wi = 10, he = 7);
par(mfrow=c(1,1));
par(cex = 1.0);
par(mar=c(8, 10.4, 2.7, 1)+0.3);
# Use function labeledHeatmap to produce the color-coded table with all the trimmings
labeledHeatmap(Matrix = pTable,
xLabels = paste(" ", consModules),
yLabels = paste(" ", femModules),
colorLabels = TRUE,
xSymbols = paste("Cons ", consModules, ": ", consModTotals, sep=""),
ySymbols = paste("Fem ", femModules, ": ", femModTotals, sep=""),
textMatrix = CountTbl,
colors = blueWhiteRed(100)[50:100],
main = "Correspondence of Female set-specific and Female-Male consensus modules",
cex.text = 1.0, cex.lab = 1.0, setStdMargins = FALSE);

共识模块、基因、性状三者互相关联

关联网络模块与性状

1
2
3
4
5
6
7
8
9
10
11
# Set up variables to contain the module-trait correlations
moduleTraitCor = list();
moduleTraitPvalue = list();
# Calculate the correlations
for (set in 1:nSets){
moduleTraitCor[[set]] = cor(consMEs[[set]]$data, Traits[[set]]$data, use = "p");
moduleTraitPvalue[[set]] = corPvalueFisher(moduleTraitCor[[set]], exprSize$nSamples[set]);
}
# Convert numerical lables to colors for labeling of modules in the plot
MEColors = labels2colors(as.numeric(substring(names(consMEs[[1]]$data), 3)));
MEColorNames = paste("ME", MEColors, sep="");

可视化

1
2
3
4
5
6
7
8
9
10
11
12
13
14
15
16
set = 1
textMatrix = paste(signif(moduleTraitCor[[set]], 2), "\n(",
signif(moduleTraitPvalue[[set]], 1), ")", sep = "");
dim(textMatrix) = dim(moduleTraitCor[[set]])
par(mar = c(6, 8.8, 3, 2.2));
labeledHeatmap(Matrix = moduleTraitCor[[set]],
xLabels = names(Traits[[set]]$data),
yLabels = MEColorNames,
ySymbols = MEColorNames,
colorLabels = FALSE,
colors = blueWhiteRed(50),
textMatrix = textMatrix,
setStdMargins = FALSE,
cex.text = 0.5,
zlim = c(-1,1),
main = paste("Module--trait relationships in", setLabels[set]))
1
2
3
4
5
6
7
8
9
10
11
12
13
14
15
16
set = 2
textMatrix = paste(signif(moduleTraitCor[[set]], 2), "\n(",
signif(moduleTraitPvalue[[set]], 1), ")", sep = "");
dim(textMatrix) = dim(moduleTraitCor[[set]])
par(mar = c(6, 8.8, 3, 2.2));
labeledHeatmap(Matrix = moduleTraitCor[[set]],
xLabels = names(Traits[[set]]$data),
yLabels = MEColorNames,
ySymbols = MEColorNames,
colorLabels = FALSE,
colors = blueWhiteRed(50),
textMatrix = textMatrix,
setStdMargins = FALSE,
cex.text = 0.5,
zlim = c(-1,1),
main = paste("Module--trait relationships in", setLabels[set]))
1
2
3
4
5
6
7
8
9
10
11
# Initialize matrices to hold the consensus correlation and p-value
consensusCor = matrix(NA, nrow(moduleTraitCor[[1]]), ncol(moduleTraitCor[[1]]));
consensusPvalue = matrix(NA, nrow(moduleTraitCor[[1]]), ncol(moduleTraitCor[[1]]));
# Find consensus negative correlations
negative = moduleTraitCor[[1]] < 0 & moduleTraitCor[[2]] < 0;
consensusCor[negative] = pmax(moduleTraitCor[[1]][negative], moduleTraitCor[[2]][negative]);
consensusPvalue[negative] = pmax(moduleTraitPvalue[[1]][negative], moduleTraitPvalue[[2]][negative]);
# Find consensus positive correlations
positive = moduleTraitCor[[1]] > 0 & moduleTraitCor[[2]] > 0;
consensusCor[positive] = pmin(moduleTraitCor[[1]][positive], moduleTraitCor[[2]][positive]);
consensusPvalue[positive] = pmax(moduleTraitPvalue[[1]][positive], moduleTraitPvalue[[2]][positive]);
1
2
3
4
5
6
7
8
9
10
11
12
13
14
15
16
17
textMatrix = paste(signif(consensusCor, 2), "\n(",
signif(consensusPvalue, 1), ")", sep = "");
dim(textMatrix) = dim(moduleTraitCor[[set]])
#pdf(file = "Plots/ModuleTraitRelationships-consensus.pdf", wi = 10, he = 7);
par(mar = c(6, 8.8, 3, 2.2));
labeledHeatmap(Matrix = consensusCor,
xLabels = names(Traits[[set]]$data),
yLabels = MEColorNames,
ySymbols = MEColorNames,
colorLabels = FALSE,
colors = blueWhiteRed(50),
textMatrix = textMatrix,
setStdMargins = FALSE,
cex.text = 0.5,
zlim = c(-1,1),
main = paste("Consensus module--trait relationships across\n",
paste(setLabels, collapse = " and ")))

导出结果

1
2
3
4
5
6
7
8
9
10
11
12
13
14
15
16
17
18
19
20
21
22
23
24
25
26
27
28
29
30
probes = names(multiExpr[[1]]$data)
consMEs.unord = multiSetMEs(multiExpr, universalColors = moduleLabels, excludeGrey = TRUE)
GS = list();
kME = list();
for (set in 1:nSets)
{
GS[[set]] = corAndPvalue(multiExpr[[set]]$data, Traits[[set]]$data);
kME[[set]] = corAndPvalue(multiExpr[[set]]$data, consMEs.unord[[set]]$data);
}
GS.metaZ = (GS[[1]]$Z + GS[[2]]$Z)/sqrt(2);
kME.metaZ = (kME[[1]]$Z + kME[[2]]$Z)/sqrt(2);
GS.metaP = 2*pnorm(abs(GS.metaZ), lower.tail = FALSE);
kME.metaP = 2*pnorm(abs(kME.metaZ), lower.tail = FALSE);
GSmat = rbind(GS[[1]]$cor, GS[[2]]$cor, GS[[1]]$p, GS[[2]]$p, GS.metaZ, GS.metaP);
nTraits = checkSets(Traits)$nGenes
traitNames = colnames(Traits[[1]]$data)
dim(GSmat) = c(nGenes, 6*nTraits)
rownames(GSmat) = probes;
colnames(GSmat) = spaste(
c("GS.set1.", "GS.set2.", "p.GS.set1.", "p.GS.set2.", "Z.GS.meta.", "p.GS.meta"),
rep(traitNames, rep(6, nTraits)))
# Same code for kME:
kMEmat = rbind(kME[[1]]$cor, kME[[2]]$cor, kME[[1]]$p, kME[[2]]$p, kME.metaZ, kME.metaP);
MEnames = colnames(consMEs.unord[[1]]$data);
nMEs = checkSets(consMEs.unord)$nGenes
dim(kMEmat) = c(nGenes, 6*nMEs)
rownames(kMEmat) = probes;
colnames(kMEmat) = spaste(
c("kME.set1.", "kME.set2.", "p.kME.set1.", "p.kME.set2.", "Z.kME.meta.", "p.kME.meta"),
rep(MEnames, rep(6, nMEs)))
1
2
3
4
5
6
info = data.frame(Probe = probes,
ModuleLabel = moduleLabels,
ModuleColor = labels2colors(moduleLabels),
GSmat,
kMEmat);
info

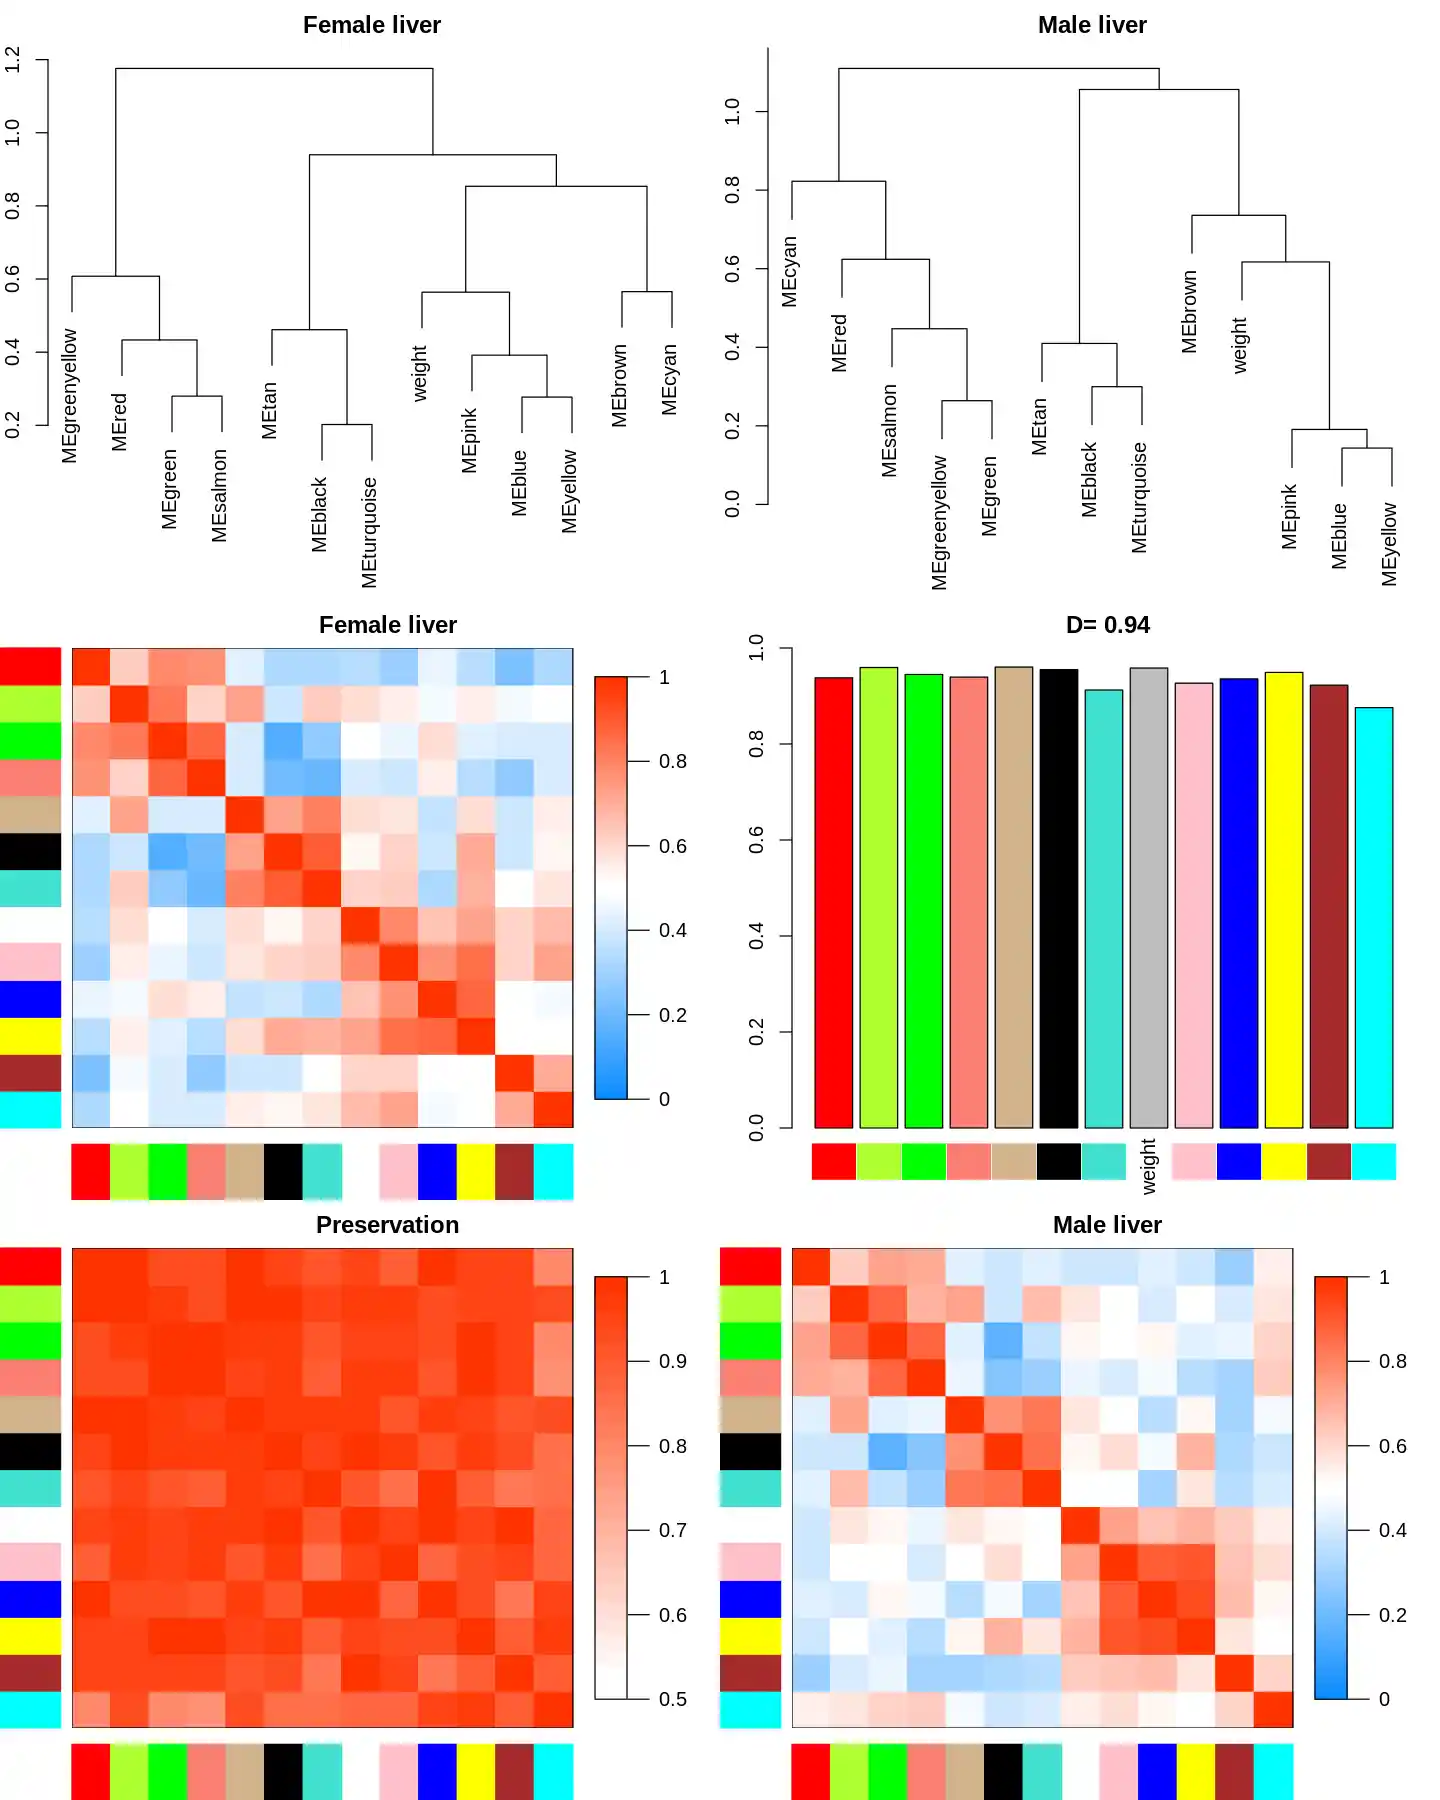
比较两者的WGCNA网络

1
2
3
4
5
6
7
8
9
10
11
12
# Create a variable weight that will hold just the body weight of mice in both sets
weight = vector(mode = "list", length = nSets);
for (set in 1:nSets){
weight[[set]] = list(data = as.data.frame(Traits[[set]]$data$weight_g));
names(weight[[set]]$data) = "weight"
}
# Recalculate consMEs to give them color names
consMEsC = multiSetMEs(multiExpr, universalColors = moduleColors);
# We add the weight trait to the eigengenes and order them by consesus hierarchical clustering:
MET = consensusOrderMEs(addTraitToMEs(consMEsC, weight));
plotEigengeneNetworks(MET, setLabels, marDendro = c(0,2,2,1), marHeatmap = c(3,3,2,1),
zlimPreservation = c(0.5, 1), xLabelsAngle = 90)


WGCNA:官方教程学习之共识分析
https://occdn.limour.top/2151.html
Author
Limour
Posted on
July 24, 2022
Licensed under