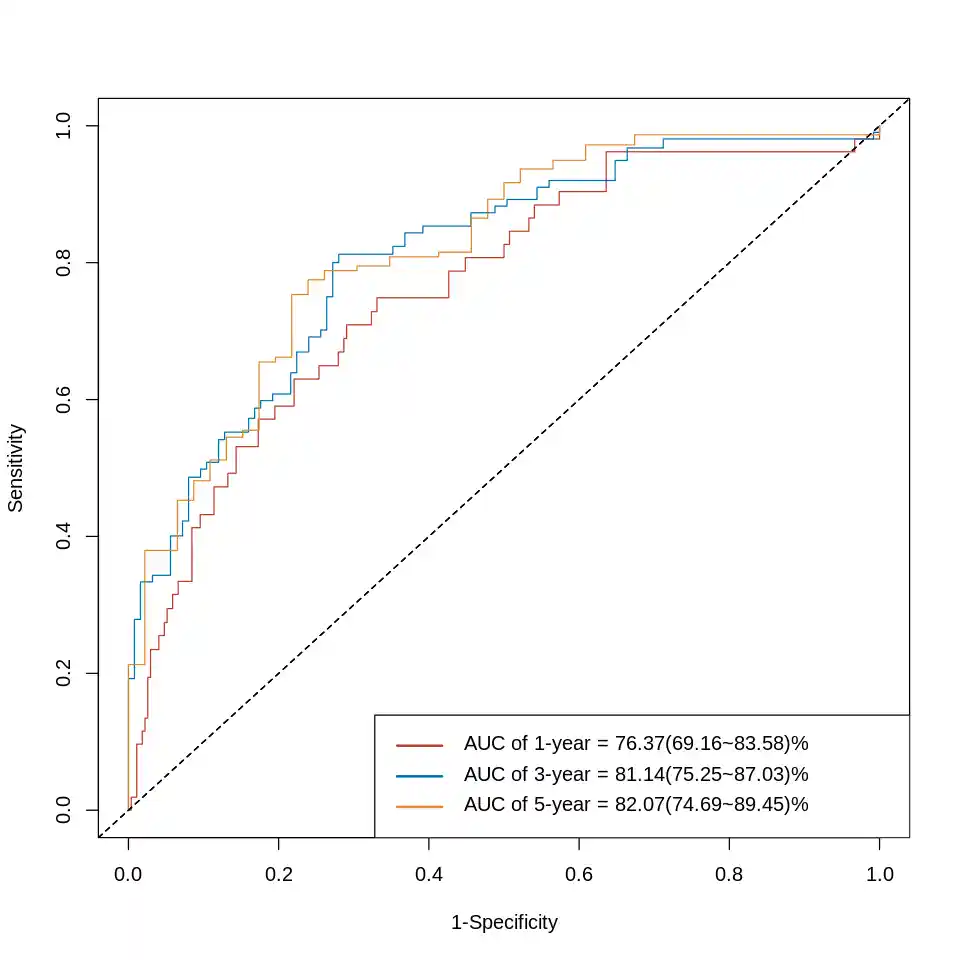
1
2
3
4
5
6
7
8
9
10
11
12
13
14
15
16
17
18
19
20
21
22
23
| require(ggsci)
library("scales")
pal_nejm("default")(8)
show_col(pal_nejm("default")(8))
options(repr.plot.width=8, repr.plot.height=8)
plot(year1$FP, year1$TP,
type="l",col="#BC3C29FF",
xlim=c(0,1), ylim=c(0,1),
xlab=("FP"),
ylab="TP",
main="Time dependent ROC")
abline(0,1,col="gray",lty=2)
lines(year3$FP, year3$TP, type="l",col="#0072B5FF",xlim=c(0,1), ylim=c(0,1))
lines(year5$FP, year5$TP, type="l",col="#E18727FF",xlim=c(0,1), ylim=c(0,1))
legend(0.6,0.2,c(paste("AUC of 1-year =",round(year1$AUC,3)),
paste("AUC of 3-year =",round(year3$AUC,3)),
paste("AUC of 5-year =",round(year5$AUC,3))),
x.intersp=1, y.intersp=0.8,
lty= 1 ,lwd= 2,col=c("#BC3C29FF","#0072B5FF", "#E18727FF"),
bty = "n",
seg.len=1,cex=0.8)
|
